


The Situation
From the 28th of February 2021, Greece is seeing consistently higher weekly deaths versus 2020 and the 5 year average.
From Week 24 to Week 35 excess deaths are up by a staggering 20.8% versus the same period in 2020 and up by an equally staggering 25.9% versus the 5 year average for the same period.
As of September 5th 2021, this trend shows no sign of slowing.
I wanted to know if the excess deaths in Greece in 2021 are because of COVID19.
Summary
The number of excess deaths in Greece, in 2021 is around the same as the number of COVID19 deaths, however the excess deaths cannot, in our opinion, be attributed to COVID19 because the highest rate of COVID19 deaths happened at a different time of the year to the highest rates of excess deaths.
Sources
Weekly deaths figures in Greece come from the statistics.gr website, the government statistics department, ELSTAT here
COVID19 death statistics come from ourworldindata.
Baseline
What is a “typical” year in Greece? How many people can we expect to die in a normal year pre COVID19?
Using this table from the ELSTAT website we can see in 2020 the number of deaths was 86121 and the average deaths per year over the previous 5 years was 83881.
What can we say about the 2015 to 2020 numbers?
Generally, the figures up to and including 2020 are quite consistent. Up to Week 35 we can see that the number of deaths per year are within a range of 79,700 deaths to 86,700 over the previous 5 years.
ELSTAT also does a graph (Graph A, below) to represent these numbers and again it shows the number of deaths per year is quite consistent between 2015 and 2020.
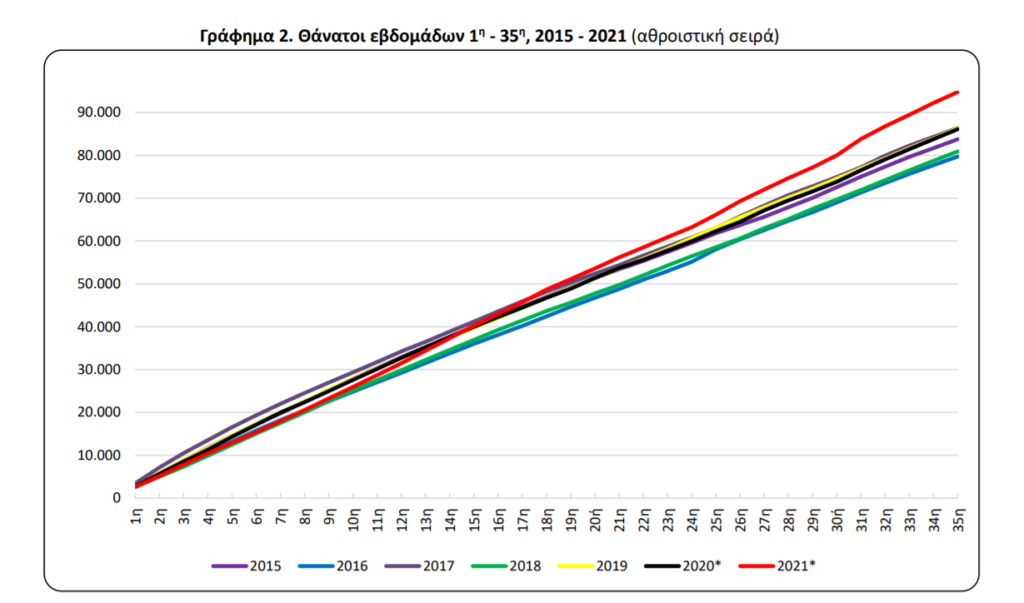
In short we can say that 2020 was a representative year with regards to the number deaths in Greece despite the presence of COVID19.
How many extra deaths (all causes)?
How many excess deaths do we have in Greece in 2021, up to week 35?
8685 more than in 2020.
10925 more than the 2015 to 2020 average
Where are the extra deaths coming from?
COVID deaths
There were 9005 deaths attributed to COVID19 up to week 35 in 2021 and this could explain the 8685 excess deaths in Greece in 2021 versus 2020. [1]As of 1st of January 2021 there were 4881 COVID deaths in Greece. As of 5th of September 2021 (week 35) number of COVID deaths was 13886. Subtracting the 1st Jan number from the 5th of September … Continue reading
Can we confirm this hypothesis?
Yes. We can look when the highest amount of COVID19 deaths occurred and compare that, to the time when the highest amount of deaths occurred from all causes. Does the increase in excess deaths occur at the same time we were seeing the highest COVID19 deaths?
ELSTAT gives the death by all causes numbers by week and we can see COVID19 deaths daily using sources like worldindata.
Do the deaths by week in ELSTAT match the deaths by week in worldindata?
Let’s overlay the weekly death graphs from ELSTAT onto the worldindata graph and see if the deaths are happening at the same time.
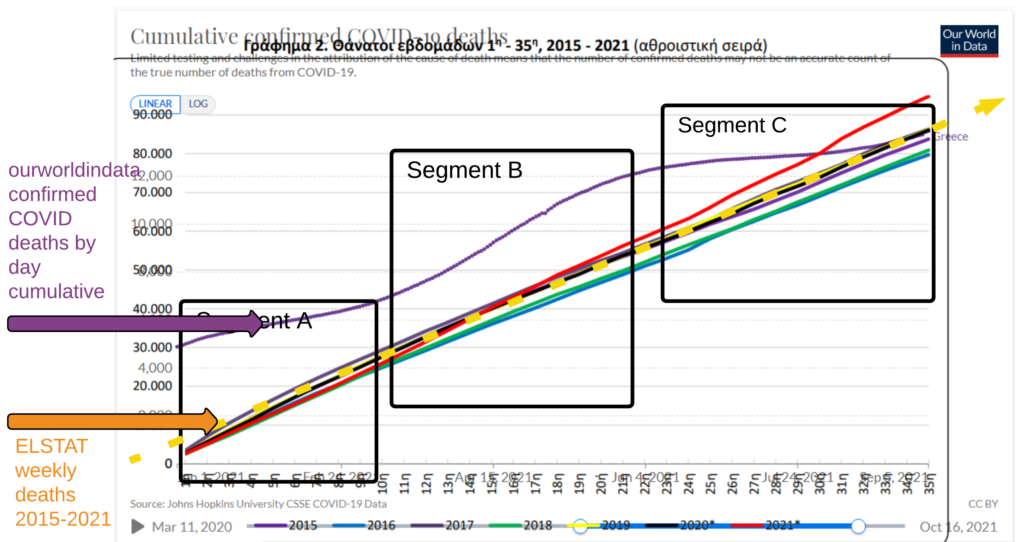
The graph above is the ELSTAT weekly deaths for 2015 to 2021 overlaid onto the worldindata graph showing daily deaths in Greece (cumulative) during the same time period (week1 to week 35).
We are looking for the gradient changes of the ourworldindata line to match the ELSTAT red line.
Segment A, Week 1-10
COVID19 Deaths = 2210
Excess Deaths vs 2020 = -1662 (less people died in 2021 at this point)
Relatively speaking the deaths attributed to COVID19 up to week 10 are flat. This is confirmed by the gradient of the ELSTAT line being consistent with other years.
If we refer back to the table at the top of this article, we can see that 2021 was actually seeing less deaths than average up to week 12.
In Short
For segment 1 we can say the COVID19 deaths and the deaths from all causes do not correlate with each other ie Despite over 2000 COVID19 attributed deaths, the number of deaths in this period vs 2020 and vs the five year average is almost 10% less.
Segment B, Week 11-22
COVID19 Deaths = 5140
Excess Deaths vs 2020 = 4318
In segment B we can see increasing daily deaths attributed to COVID19.
The ELSTAT red line (Graph 1, 2021 deaths) has also started steepening during this time.
In Short
For Segment B we can say deaths from all causes and deaths attributed to COVID19 are in sync. As COVID19 attributed deaths per day increased so did number of deaths from all causes.
Segment C, Week 24-35
COVID19 Deaths = 1585
Excess Deaths vs 2020 = 5448
For Week 22 through to at least Week 33, the daily deaths attributed to COVID19 reduced and were even lower than Segment A.
We would have expected the 2021 (red) line for deaths by all causes to also become shallower and match the gradient for the other years (Graph A).
Unfortunately we did not see this.
Instead we saw increasing weekly deaths as the weekly deaths attributed to COVID19 were decreasing.
In Short
The increased excess deaths from Week 22 onward, which are around 17% higher than in 2020, can not be attributed to COVID19.
Generally, can the excess deaths in 2021 be explained by COVID19?
In Segment A we can see a massive disparity between COVID19 deaths and excess deaths. The reasons for this is unclear but regardless of the cause we can say the connection between excess deaths and COVID19 during this period is unclear.
In Segment B we can see a clear relationship between the number of excess deaths and the number of COVID19 attributed deaths. In this case we can say the excess deaths can be attributed to COVID19.
In Segment C we again see a massive disparity between the number of excess deaths and the number of COVID19 deaths, this time in the other direction ie more excess deaths than COVID19 deaths by over a factor 3. The excess deaths in Segment C cannot be attributed to COVID19.
Conclusion
While the number of deaths (9,005) attributed to COVID19 in Greece in 2021 is similar to the number of excess deaths (8,686) [2]vs 2020 we cannot attribute these excess deaths to COVID19 because the deaths occurred at different times of the year.


More Stories
Τροχαίο Βουλή: Ποινή 3 ετών με αναστολή στον οδηγό της Ντ. Μπακογιάννη για τον θανάσιμο τραυματισμό του φοιτητή
Γ. Καλλιάνος: «Θα γίνω ο εφιάλτης τους» – Τι απαντά ο καθηγητής αγγειοχειρουργικής
Τα νεότερα για την κατάσταση της υγείας του Δημήτρη Κόκοτα